Give the roadmap argument somewhere to land
Paperline has three persuasive roadmap requests: fix citation export, add shared folders, and build automatic summaries. The summary reaches the biggest audience. The export fix removes a serious block. The team can staff only one first, and another round of enthusiastic presentations will not settle the tradeoff.
Paperline is a hypothetical notebook app for research groups. Its projects, reach estimates, confidence judgments, effort figures, and proposed investigations below are invented.
RICE compares product ideas using reach, impact, confidence, and effort. It gives a roadmap discussion a shared set of assumptions to inspect. Sean McBride’s Intercom guide defines the formula and scales used here.
RICE score = (Reach × Impact × Confidence) / Effort
A higher score suggests more expected impact for the effort, within one consistent comparison. It does not prove an idea is strategically right. You still need to know which customer problem you are trying to solve.
Agree what the comparison is trying to improve
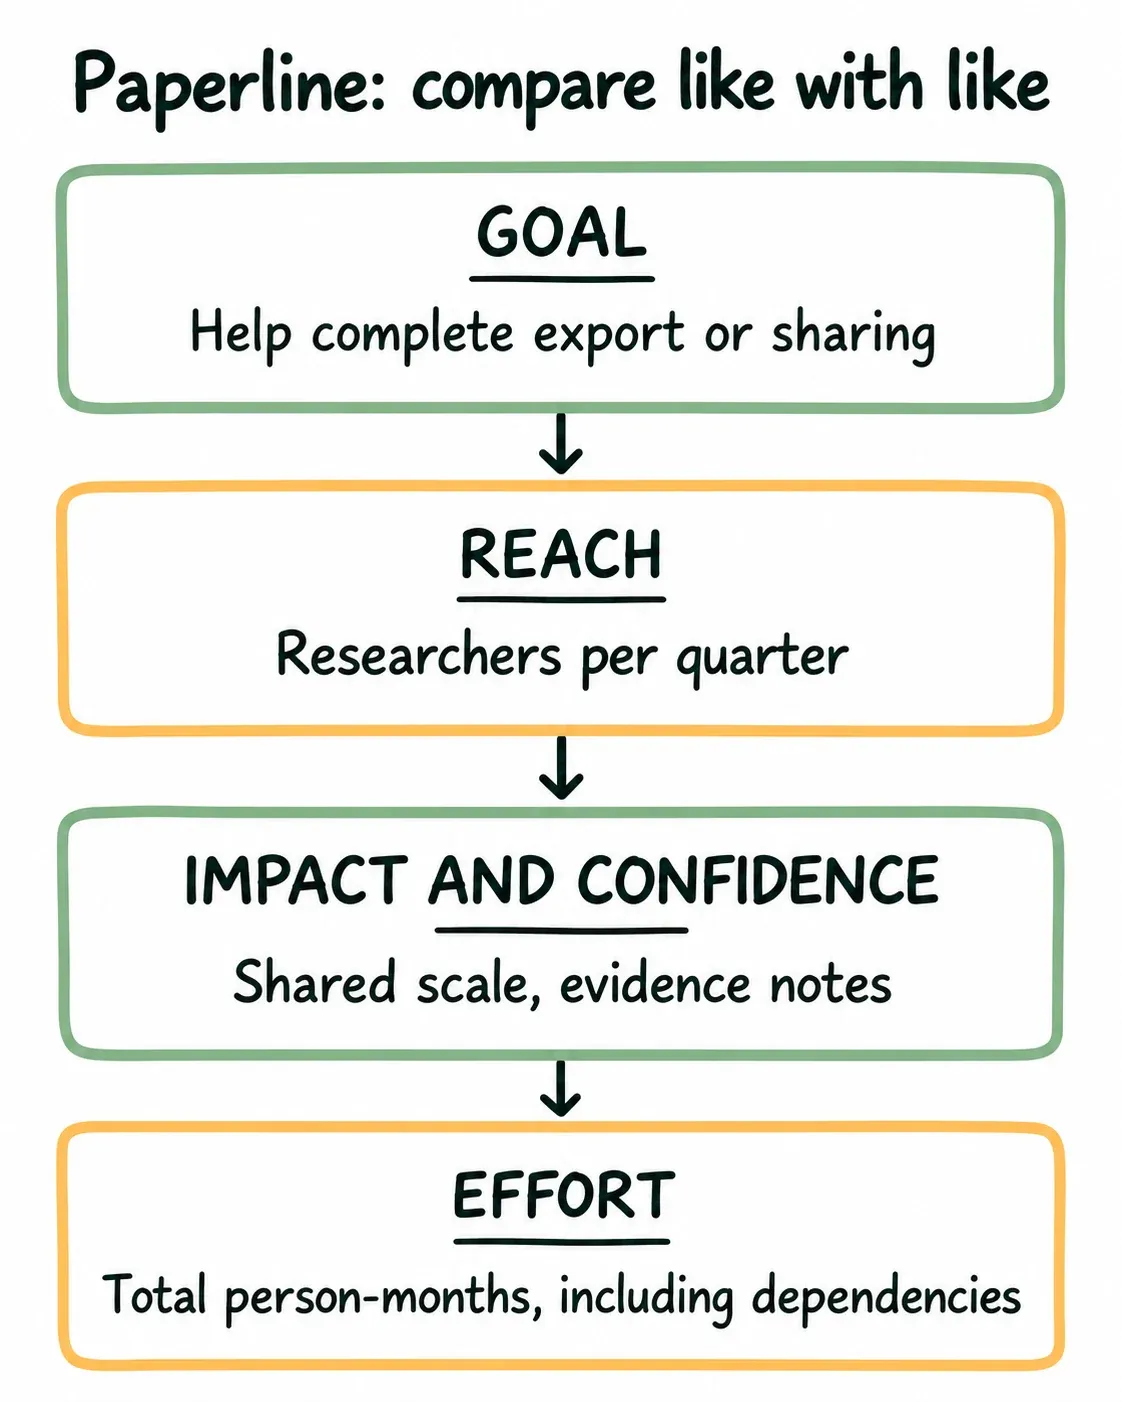
Paperline chooses one goal: help researchers complete an export or sharing task. It counts researchers per quarter, uses one impact scale, and estimates total person-months. Those agreements come before scores; otherwise the team could compare incompatible inputs with perfectly correct arithmetic.
The board records the comparison contract. Next, the team needs the evidence behind reach, impact, confidence, and effort. The formula can expose those assumptions, but it cannot make an unsupported estimate true.
Estimate four things, consistently
Score = (Reach × Impact × Confidence) / Effort
- Reach
- People or events in one time window, such as customers per quarter.
- Impact
- Effect on one person: 3, 2, 1, 0.5, or 0.25.
- Confidence
- How well the estimates are supported: 100%, 80%, or 50%.
- Effort
- Total person-months across the roles doing the work, even when they work in parallel.
Reach, impact, and confidence multiply: changing any one changes the expected effect. Effort divides that result: an equally valuable idea becomes less attractive when it consumes more of the team.
Reach: how many people or events?
Choose a time window and a counting unit, then keep both across the comparison. Paperline will count affected researchers per quarter. Other teams might count transactions per month, but mixing those units would make the ranking meaningless.
Prefer product evidence to “everyone will use this.” If 500 researchers encounter a workflow each month and you estimate 30% would use the change, quarterly reach is 500 × 0.3 × 3 = 450 affected encounters. If your chosen unit is unique people, check for repeat users before calling those 450 different researchers.
A good reach estimate says where the number came from. That lets someone challenge an assumption rather than arguing over the resulting score.
Impact: how much does it help each person?
Intercom’s scale uses 3 for massive, 2 for high, 1 for medium, 0.5 for low, and 0.25 for minimal impact. These are coarse judgments about the effect on one person reached, not the size of the audience.
Connect the judgment to your stated goal. Fixing a blocked export could be massive for the affected researcher. A cosmetic change might have minimal effect on the same task. Both can reach many people; that does not give them equal impact.
Agree what the labels mean before scoring favored projects. If two people disagree about “massive,” write down the expected change in behavior. Averaging their numbers skips the useful conversation.
Confidence: how much support do the estimates have?
Intercom uses 100%, 80%, and 50% as practical confidence levels. Enter them as 1, 0.8, and 0.5 in the formula. Confidence below that calls for particular caution about the evidence behind the idea.
This is a discount for uncertain estimates, not a statistical confidence interval. An exciting demo is not automatically evidence of customer demand. A familiar project is not automatically well understood either.
For Paperline, observed export failures support more confidence than an untested belief that researchers want automatic summaries. Keep a brief evidence note beside the percentage so the optimism has somewhere to answer questions.
Effort: how much total work?
Estimate person-months across the people doing the work, including product, design, research, engineering, and other necessary roles. Use rough estimates; Intercom suggests coarse values, including 0.5 for work well under a person-month.
Person-months measure work, not elapsed calendar time. One month from a designer plus two months from an engineer is three person-months even if some work happens in parallel.
Include dependencies and rollout work that would otherwise disappear from the estimate. Effort is in the denominator, so forgetting migration or support preparation can make an idea look suspiciously brilliant.
Follow one comparison from inputs to decision
Paperline can choose among three scoped projects. Its team records the following teaching numbers:
| Project | Reach per quarter | Impact | Confidence | Person-months | Score |
|---|---|---|---|---|---|
| Fix citation export | 400 | 3 | 1.0 | 1 | 1,200 |
| Shared project folders | 1,200 | 2 | 0.8 | 3 | 640 |
| Automatic notebook summary | 2,000 | 2 | 0.5 | 5 | 400 |
Shared folders score 1,200 × 2 × 0.8 / 3 = 640. The export fix reaches fewer researchers, but it removes a serious block, rests on stronger evidence, and needs less effort. It comes first with a score of 1,200.
The summary has the widest reach and still ranks last. That is useful information: a large audience cannot fully rescue an uncertain idea with substantial effort.
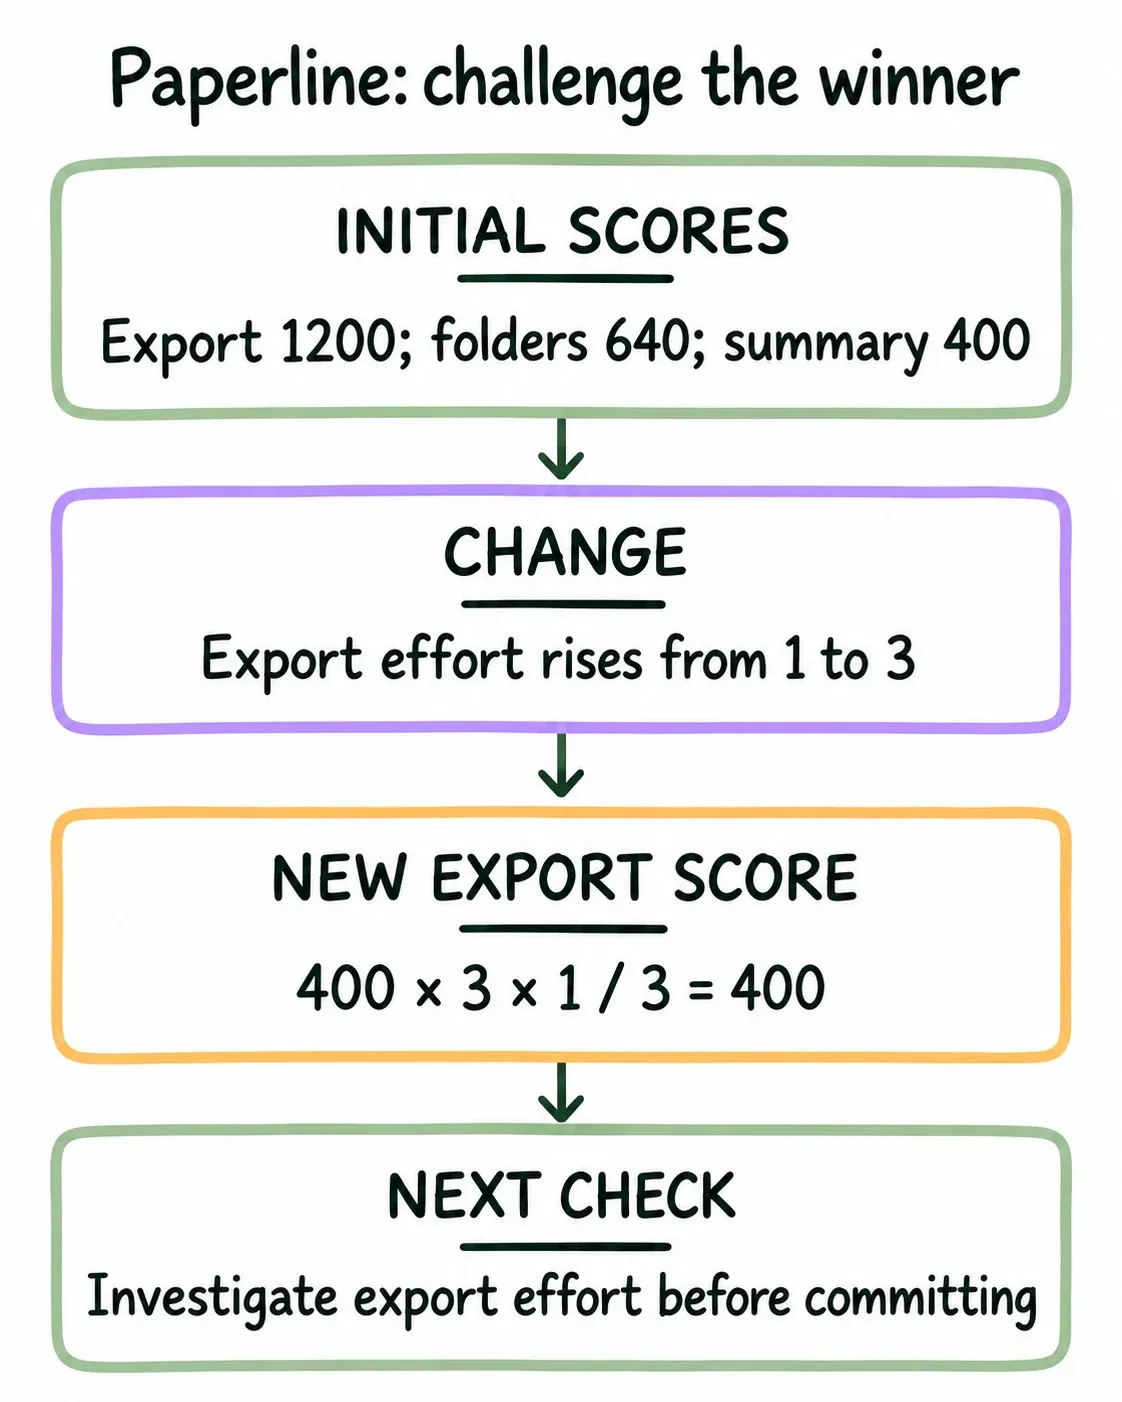
Now challenge the ranking. What if the export fix takes three person-months instead of one? Its score becomes 400 × 3 × 1 / 3 = 400. Shared folders would then move ahead. The “obvious winner” was sensitive to the effort estimate.
That sensitivity tells Paperline what to investigate next. A short technical check on the export work may be more valuable than another long debate about the summary’s potential. Do enough investigation to improve the decision, without turning every estimate into a full project plan.
Investigate the input that could change the order
Export initially scores 1,200, ahead of folders at 640 and summaries at 400. Changing export effort from one to three person-months drops it to 400. That is a practical reason to investigate the technical work before committing the roadmap.
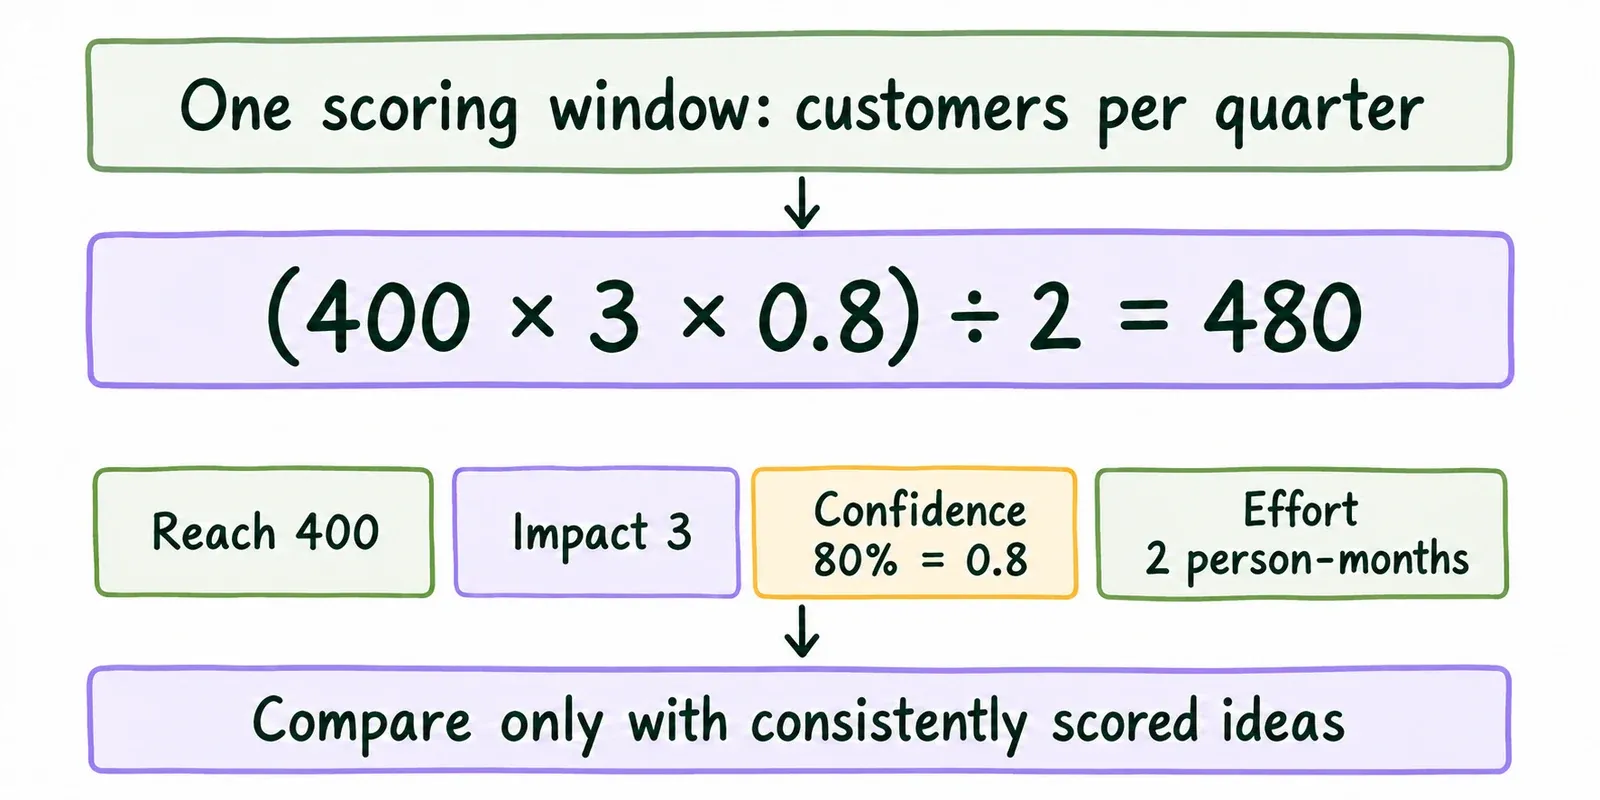
Keep this sensitivity check separate from the 480 example above, which changes both confidence and effort. Each scenario answers a different question. Paperline should record which assumptions support its actual decision and which finding would trigger a new comparison.
Run your own scoring session
The scales above follow Intercom. This session outline is FrameworkWorld’s practical application.
- Set one goal. Write the customer outcome that impact refers to. Do not mix revenue, delight, and reliability without explaining their relationship to that goal.
- Separate work that must happen. Outages, fixed obligations, and commitments already made consume capacity whether or not they win a score.
- Scope comparable options. “Improve onboarding” is a theme. A defined change to one onboarding step is something you can estimate.
- Fix the reach unit and window. Put them in the column heading, where nobody has to remember them.
- Record inputs and evidence. Add one short reason for impact and confidence. Label assumptions and uncertainty in effort.
- Calculate, sort, and challenge outliers. Inspect anything that feels unexpectedly high or low. Correct an input when the challenge holds.
- Choose and date the decision. Record dependencies, any deliberate override, and what new evidence would trigger a review.
An override can be reasonable. Perhaps shared folders are needed before another committed project can work. State that reason explicitly. Quietly raising its confidence to manufacture the desired ranking makes the next scoring session less trustworthy.
Avoid the spreadsheet traps
Precision in the answer is not precision in the evidence. A score of 640 looks exact because arithmetic is exact. Reach, impact, and effort may still be rough estimates. Inspect close rankings rather than treating a small difference as a verdict.
Confidence can become a popularity vote. Ask what supports the weakest important input. If nobody has evidence about demand, enthusiasm from five colleagues does not remove the uncertainty.
Dependencies can distort individual scores. A foundation project may unlock several later ideas. Score a useful package or explain that dependency beside the ranking; do not count the same future benefit several times.
Reach can reward volume over importance. A small group may have a critical need. Required work should not have to compete against a broad but optional improvement solely on audience size.
Stale scores lose their meaning. A new customer base, changed effort estimate, or failed experiment can change the order. Keep dates and evidence close to the numbers.
Know when to use another tool
RICE fits a backlog of scoped ideas drawing on the same people. It is less useful for choosing a company strategy or a market, where the uncertainties and consequences are broader than one product score.
Use Jobs to Be Done when impact is vague because you do not understand the progress customers want. Better discovery gives the formula something useful to compare.
Use SWOT for the wider strategic situation. Use MoSCoW when the immediate job is agreeing what a release must include.
For Paperline, the useful result is a candidate order, an exposed uncertainty about export effort, and a named next check. The spreadsheet has helped the team make a decision it can explain and revise.
Sources and further reading
- Sean McBride, “RICE: Simple prioritization for product managers,” Intercom: intercom.com/blog/rice-simple-prioritization-for-product-managers. The scales, the percentage treatment of confidence, the person-month estimate, and the formula used here follow that article.
- This page’s numerical example is hypothetical and is not from Intercom.