Which business deserves the next investment?
The sensor team wants investment because its market is growing. The tools team wants to replace equipment that keeps a dependable business running. At Vale Equipment’s budget meeting, both requests sound reasonable. Moving all the money toward the more exciting slides would be an expensive way to settle the argument.
Vale Equipment is a hypothetical supplier comparing a mature maintenance-tools line with a newer sensor business. All company details, market figures, and decisions in this walkthrough are invented.
The BCG matrix compares businesses by market growth and relative market share. Also called the growth-share matrix, it provides a starting map for portfolio investment decisions. Its four positions are stars, cash cows, question marks, and pets, often called dogs.
First agree what the dots would mean
Vale starts with two product lines, rather than mixing a whole division with one feature. It needs a comparable market definition, period, and share measure for each. Otherwise, a business can become a market leader simply because someone has drawn a smaller market around it.
The first graphic records the share calculation. Growth comes next: the tools market grew 3%, the sensor market 15%, and Vale chose 8% as this review’s dividing line. That cutoff belongs to this example; it is not a universal BCG rule.
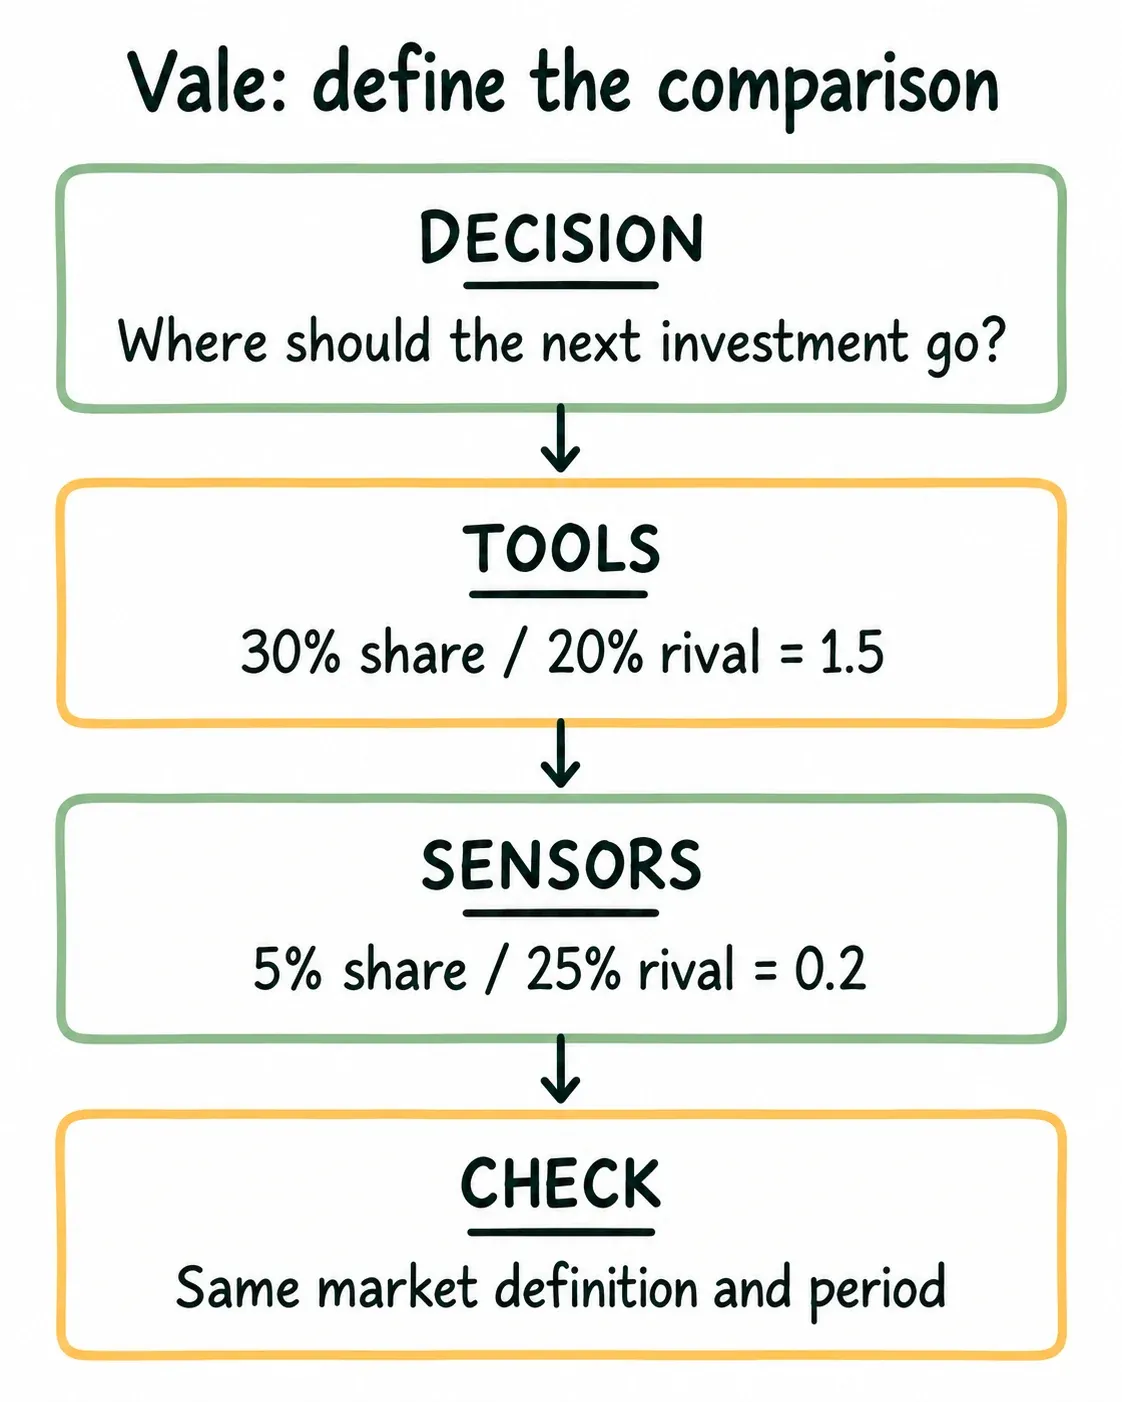
Growth is a proxy for market attractiveness; relative share is a proxy for competitive position. Neither is a complete verdict. Vale still needs cash, margin, investment, and dependency evidence beside its position.
Four positions, four questions
Market growth × Relative market share
High growth · High relative share
Stars
Test the investment needed to sustain a strong position.
High growth · Low relative share
Question marks
Choose selectively: can investment build a stronger position?
Low growth · High relative share
Cash cows
Check the cash available after maintaining the business.
Low growth · Low relative share
Pets / dogs
Examine niche value, dependencies, and possible exit.
Read market growth vertically and relative market share horizontally. Each business belongs in one cell for the market and period you defined. Moving a boundary can move the business without changing its underlying economics.
- Stars: high growth and high relative share. What investment would preserve the position as the market develops?
- Cash cows: low growth and high relative share. What cash can the business release after maintaining its ability to compete?
- Question marks: high growth and low relative share. Is there a credible route to a stronger position, and what would it cost?
- Pets or dogs: low growth and low relative share. Does the business have a valuable niche, a role elsewhere in the portfolio, or a reason to exit?
BCG’s explanation connects these positions to investment, cash generation, selective backing, and possible divestment. The questions above are FrameworkWorld’s prompts for checking those choices against actual evidence.
Define the market before plotting the business
For this article, calculate relative market share as the business’s share divided by the largest rival’s share, using the same market definition and period. A ratio above one means the business is larger than its largest rival on that measure. Revenue share and unit share are different measures; choose one and record why.
Do not adopt a universal growth cutoff merely to fill the diagram. State what counts as high growth for this portfolio, over which period, and in which currency or volume measure. A price increase can raise revenue without expanding demand.
The matrix’s logic assumes that share and growth tell you something useful about future cash needs and competitive strength. Check that assumption against margins, retention, investment requirements, and the way customers choose. A small specialist can be profitable without becoming the market leader.
Read the investment story behind the position
A star may need substantial investment just to keep up with a growing market. Its strong share does not mean that all its revenue is available to fund other businesses. Ask what maintaining that position actually costs.
A cash cow can release money after maintaining the capabilities customers rely on. Treating maintenance as optional can damage the very business expected to support the portfolio. “Mature” does not mean “runs itself.”
A question mark creates a choice: invest selectively to test a credible route to strength, or limit the exposure. Funding every fast-growing opportunity can spread resources so thinly that none receives enough to become competitive.
A dog may still have a profitable niche or support a larger customer relationship. Before closing it, check what else depends on its people, technology, or distribution. The matrix cannot see a dependency you have not written down.
For each position, write both a funding idea and a reason it might be wrong. This keeps the label from quietly becoming a budget rule. A stronger share position may not deliver lower costs in your market; investigate whether scale actually creates an advantage before assuming that it does.
Read Vale’s two positions, then inspect the cash
The tools line has 30% of its defined market, compared with 20% for its largest rival. Its relative share is 30 / 20 = 1.5. Market revenue grew 3% over the agreed year. The team had set 8% as this review’s high-growth boundary, so the tools line sits in the cash-cow cell.
The sensor line has 5% share against a rival’s 25%, giving 5 / 25 = 0.2. Its market grew 15%, placing it in question marks. The matrix makes the funding tension visible, but it does not justify moving every available unit of cash to sensors.
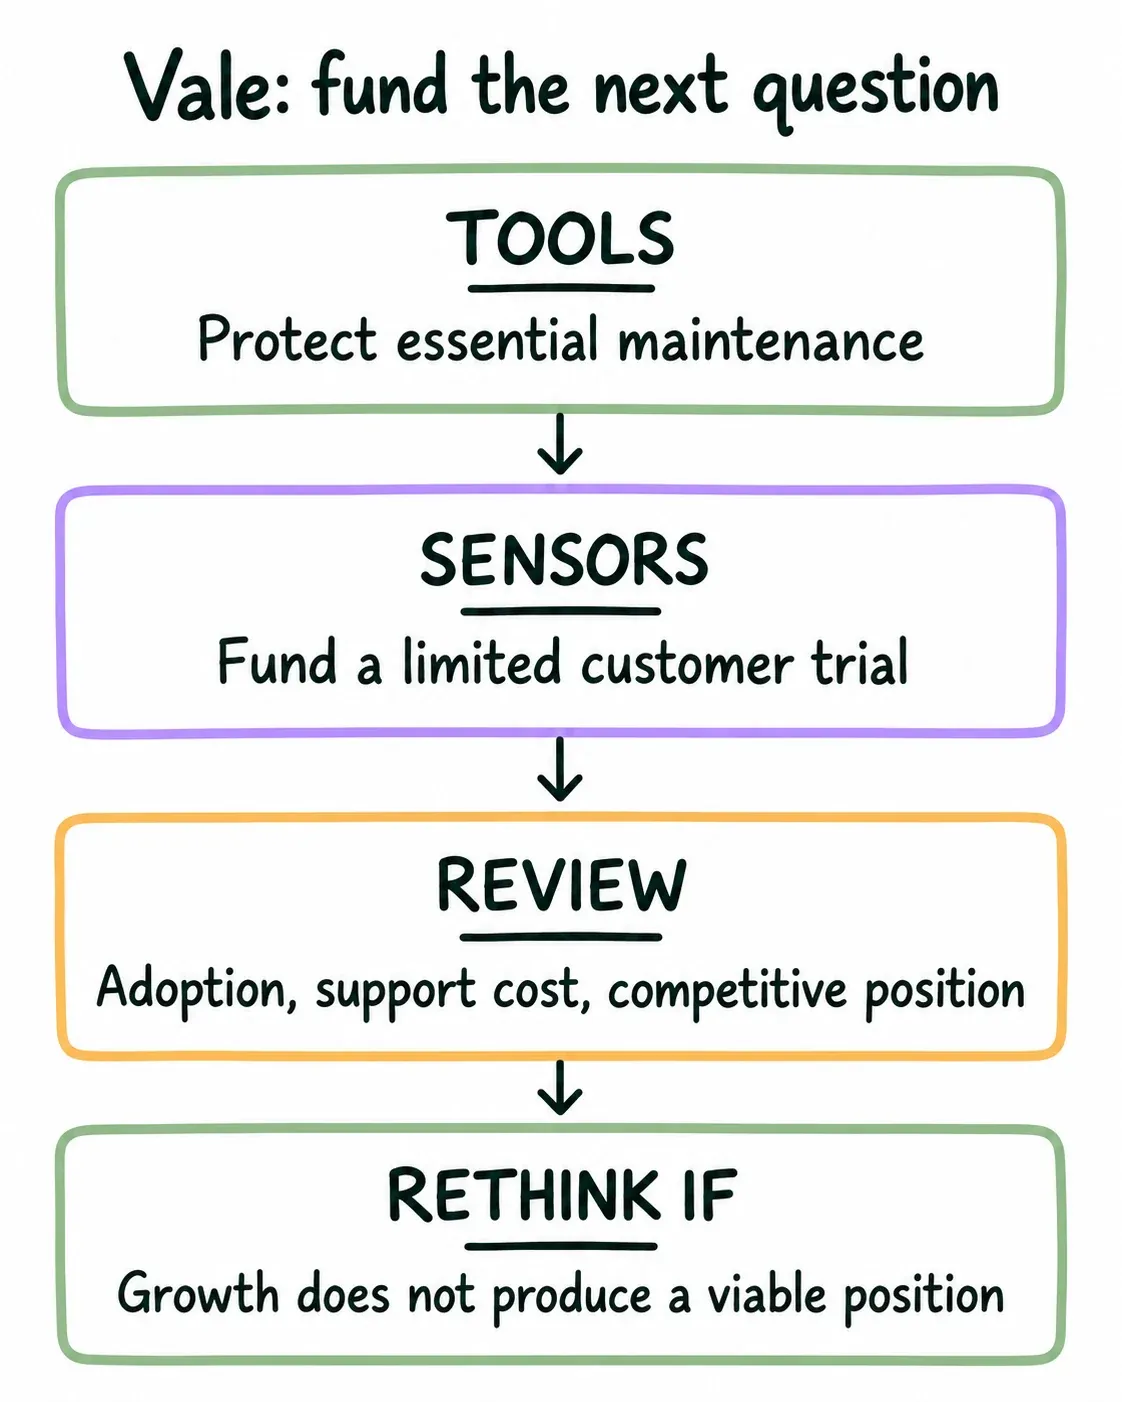
The team first protects essential maintenance investment in tools. It then funds a limited sensor trial with a named customer group and reviews customer adoption and support cost before expanding. If the trial does not support a defensible position, growth alone will not earn another budget increase.
Put the numbers beside the labels
| Vale line | Own share / largest rival | Market growth | Position in this review | Next question |
|---|---|---|---|---|
| Maintenance tools | 30% / 20% = 1.5 | 3% | Cash cow | What upkeep protects reliable cash generation? |
| Sensors | 5% / 25% = 0.2 | 15% | Question mark | What evidence justifies the next investment? |
These are hypothetical figures. Vale’s chosen growth boundary is 8%; it is not a universal BCG threshold. The table preserves the assumptions that make the positions interpretable.
Now challenge the market boundary. If Vale counted only a specialist sensor segment where it is already strong, the sensor dot could move without the business acquiring one additional customer. Neither definition is automatically right. Choose the market that reflects the actual competitive decision and show a reasonable alternative if the boundary is disputed.
Before approving funding, Vale also checks whether the tools line needs a coming equipment replacement and whether sensors use its service team. Those commitments can reduce the cash available for experimentation. Portfolio allocation works with cash and capacity, not labels alone.
The team records what would earn another sensor investment: evidence of a repeatable customer need, support costs it can sustain, and a plausible competitive position. It also records what would stop the trial. Without those checks, every disappointing quarter could become a reason to fund just one more quarter.
A useful review ends with conditional commitments and a date. It does not require every business to move neatly through all four boxes.
Turn the portfolio position into a conditional commitment
The decision has changed from “back the growing business” to “protect today’s engine while testing tomorrow’s possibility.” Vale should name the sensor customers, the trial boundary, and the evidence required before it increases funding. Adoption without sustainable support costs would leave an important question unanswered.
The graphic is a decision record, not a forecast of the businesses moving neatly through four cells. If a trial cannot establish a plausible competitive position, a fast-growing market does not rescue the case for more investment.
Run a portfolio review
- List comparable businesses or product lines. Avoid comparing an entire division with one minor feature.
- Define each relevant market, the measurement period, and the source of share and growth estimates. Mark uncertain inputs.
- Agree on the dividing lines before looking at which teams benefit from them.
- Plot the businesses. Repeat the placement with a plausible alternative market boundary if the definition is disputed.
- Add cash generation, capital needs, strategic dependencies, and customer commitments beside each point.
- Write an investment hypothesis for each business, including evidence that would reverse it. Decide on a review date before committing resources.
If reliable market data is unavailable, stop short of a precise classification. A range with an explicit uncertainty is more useful than a confident dot built from guesses.
Limits and alternatives
The two axes omit many things that matter: switching costs, different margins, shared infrastructure, and the option value of a small business. A low-share line may support a larger contract. Divesting it could damage another unit that looks attractive in isolation.
Use the matrix for portfolio allocation discussions, not for ranking individual backlog items or forecasting returns. Never assume a star will become a cash cow or that a dog must be closed. Those are decisions requiring more evidence.
Porter’s Five Forces examines whether industry structure allows attractive profits. Use it to challenge the idea that a growing market is necessarily a good market.
Business Model Canvas connects customers, delivery, partners, revenue, and costs. Use it to expose dependencies that a portfolio dot hides.
Sources and further reading
- Boston Consulting Group, What Is the Growth Share Matrix?, accessed October 21, 2026. Official explanation of the axes, four positions, and portfolio logic. The review process, calculation example, and investment checks here are editorial applications.