More traffic is only one possible answer
The reporting-software team wants more trial accounts. Its campaign proposal is ready when someone opens the existing cohort: many accounts entered the trial, far fewer reached evaluation, and fewer bought. Before paying to fill the top again, the team needs to understand what happens in the middle.
Harbour Reports is hypothetical reporting software. This walkthrough follows its trial. All accounts, conversion figures, obstacles, and proposed investigations are invented; they are not customer results.
A sales funnel groups prospective buyers by their progress toward a purchase. It helps you count movement between stages and decide where to investigate. Salesforce describes the journey from awareness to purchase while noting that actual routes depend on the buyer and offer.
Count the same people through a defined window
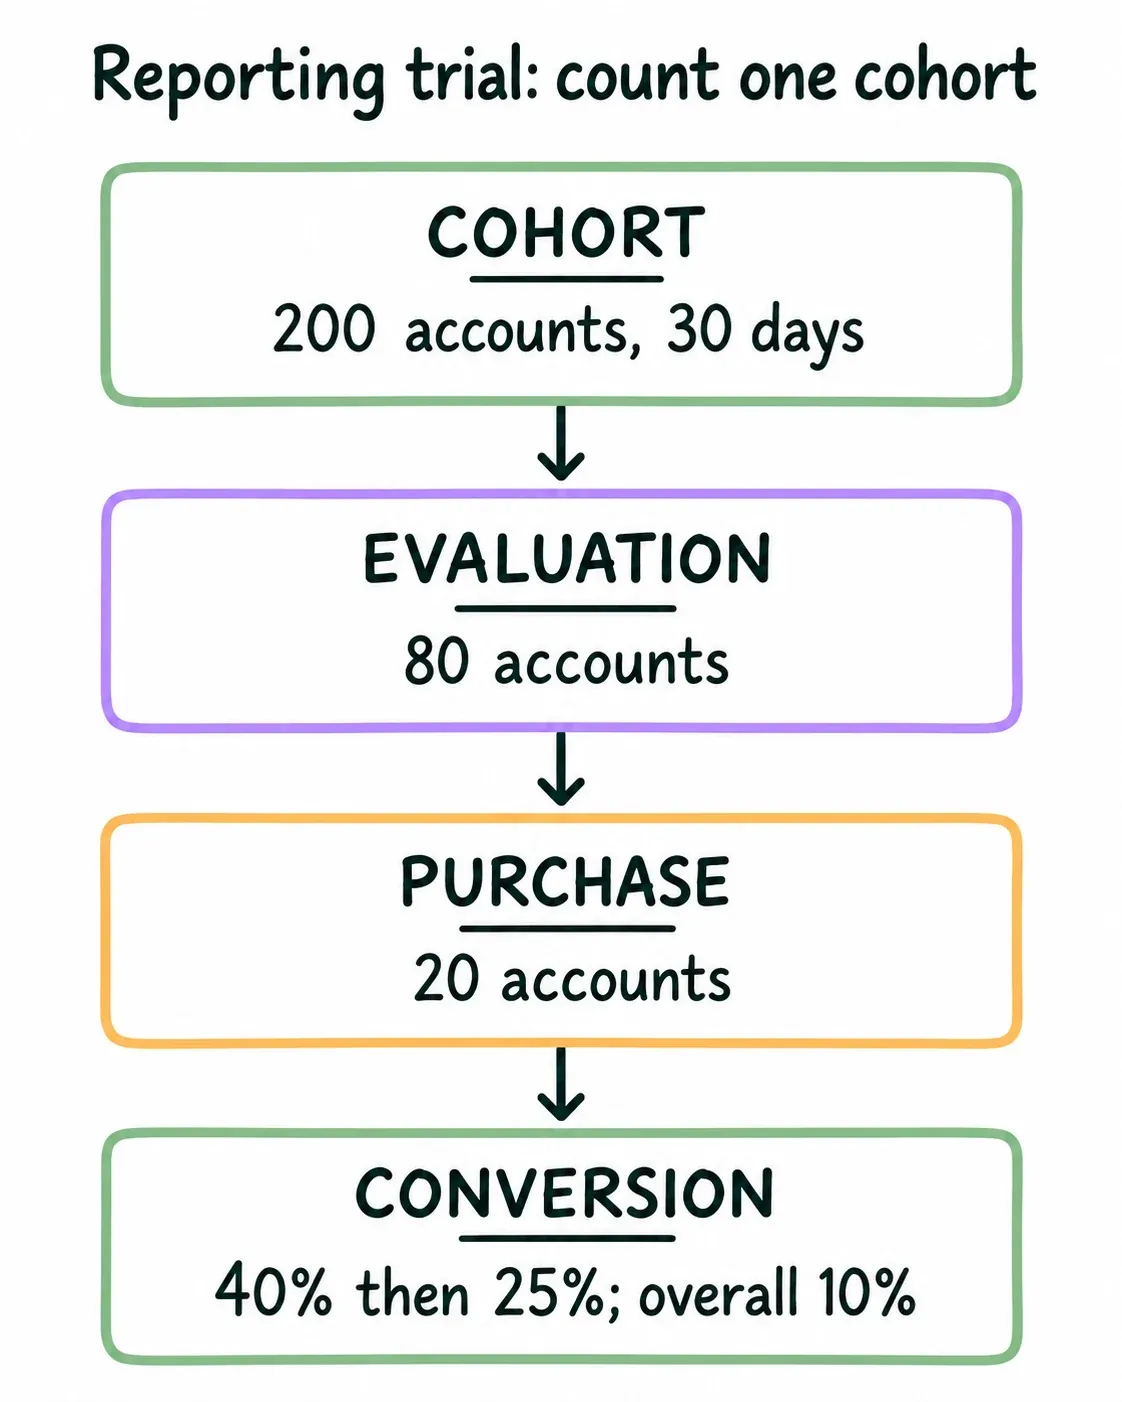
The walkthrough follows 200 accounts over 30 days. Eighty reach the defined evaluation event and twenty purchase. Those are accounts throughout—not a mixture of page views, people, and subscriptions. The event definitions and observation window belong beside the numbers.
The resulting 40%, 25%, and 10% conversions describe this invented cohort. They locate transitions to investigate. They do not establish that a website, salesperson, or import feature caused an account to stop.
Define stages by evidence
There is no universal set of stages. Use observable events that fit this buying process.
Awareness
Encounters the offer; name the proxy you can observe.
Interest
Takes a meaningful next step, such as starting a trial.
Evaluation
Checks the offer against their requirements.
Purchase
Makes the defined buying commitment.
This article uses awareness, interest, evaluation, and purchase as a simple illustrative funnel. The narrowing shows that fewer prospects usually reach later stages; it does not imply measured proportions. Renewal and expansion can be tracked after purchase where relevant.
People may return to an earlier stage, buy without a recorded first visit, or leave for reasons outside your control. The funnel is a measurement view of that journey, not a claim that every person follows a straight line.
Awareness
The prospect encounters the offer. Actual awareness is hard to observe directly. If you use visitors or ad reach as a proxy, name that proxy and its limits. An impression is not proof that a person understood the offer.
Interest
The prospect takes a meaningful next step. It could be requesting information or starting a trial. Choose an action that is relevant to your buying process rather than declaring every click a qualified lead.
Evaluation
The prospect checks whether the offer meets their requirements. For one business that is a completed demo; for another it is using a key trial capability. A seller sending a proposal does not prove the buyer has evaluated it.
Purchase
Define the commitment that counts: a paid order, signed agreement, or another explicit business event. Keep cancellations and refunds visible so the final stage does not overstate useful outcomes.
These descriptions are FrameworkWorld’s working example. Your own stages should be specific enough that two people classify the same prospect the same way.
Measure conversion without mixing the population
For a defined group and observation window, stage conversion is:
Stage conversion = (Prospects reaching the next stage / Prospects entering this stage) × 100%
Use the same unit throughout: people, accounts, or opportunities. Deduplicate records and decide how to handle returning prospects. A person count at the top and an account count at the bottom do not form a reliable conversion rate.
Prefer a cohort: a group that entered the funnel in the same period and that you follow forward. Dividing this month’s purchases by this month’s new trials can mislead when those purchases came from older trials. Give the cohort enough time to complete the buying cycle and report how long you observed it.
If nobody entered a stage, its conversion rate is undefined, not zero. If records skip stages, show the missing path or improve tracking rather than quietly changing the denominator.
Decide what the numbers can and cannot say
A stage rate describes movement in the population and period you defined. It does not explain motivation by itself. Low evaluation-to-purchase conversion might reflect price, poor fit, approval delays, a missing capability, or a measurement problem.
Start by checking a few individual journeys. A tracking event that did not fire can look like a customer who never evaluated the offer. Several employees from one account can look like several separate buyers if the unit changes halfway through.
Time matters too. Accounts that have only had three days to decide are not directly comparable with accounts observed for thirty. Report the window alongside the rate and keep still-open opportunities visible.
For business purchases, a single account may contain a daily user, a budget owner, and a security reviewer. The account can remain in evaluation while different people do different work. Define the event that demonstrates progression rather than treating the seller’s last email as the buyer’s decision.
Before testing a change, state the buying obstacle you think it addresses. “Improve the funnel” is broad. “Help trial accounts import their existing reports so they can evaluate the key workflow” connects an action to a stage and a plausible reason to move.
Read the trial’s transitions, then investigate import
Trial-to-evaluation conversion is 80 / 200 × 100% = 40%. Evaluation-to-purchase conversion is 20 / 80 × 100% = 25%. Overall trial-to-purchase conversion is 20 / 200 × 100% = 10%. These are invented counts for the calculation, not industry benchmarks.
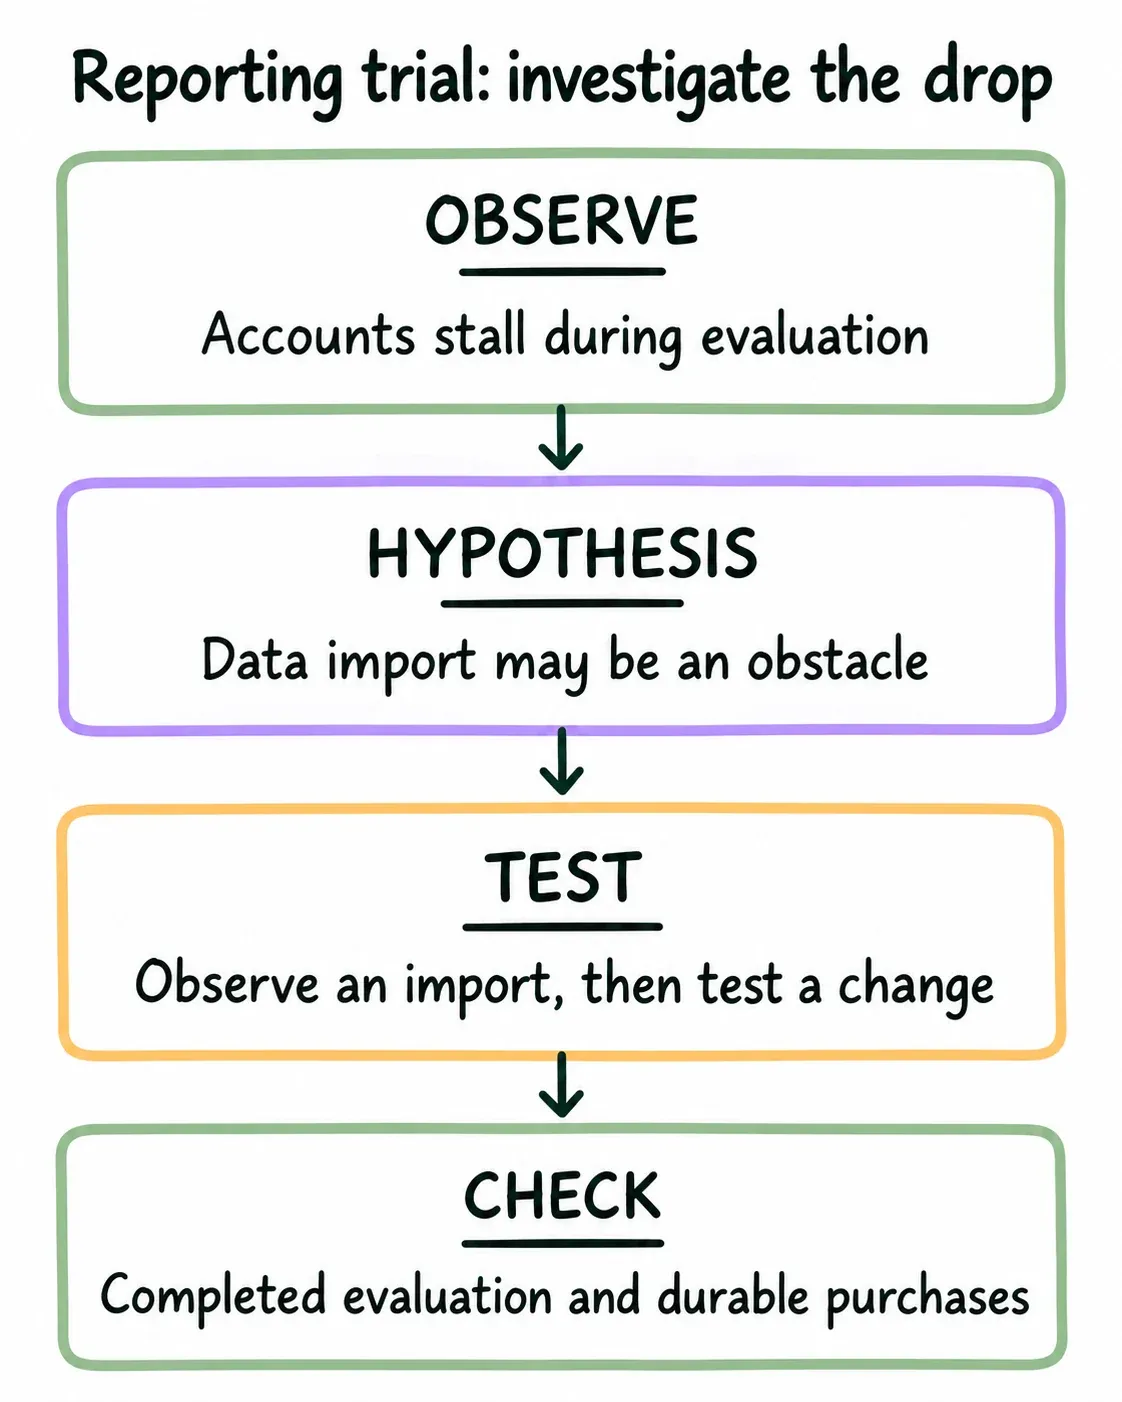
The team initially wants more trial traffic. Conversations with accounts that stopped reveal that some could not import their existing reports. It decides to test clearer import guidance first. The next cohort will be observed for the same 30 days, with acquisition mix noted.
The funnel did not prove that import guidance will increase sales. It showed where a useful investigation could start. Buying more traffic before checking that obstacle would repeat the same uncertainty at larger scale.
Read the same cohort three ways
| Transition in the hypothetical trial | Calculation | Rate |
|---|---|---|
| Trial to evaluation | 80 / 200 × 100% | 40% |
| Evaluation to purchase | 20 / 80 × 100% | 25% |
| Trial to purchase | 20 / 200 × 100% | 10% |
All three rates describe the same 200-account cohort observed for thirty days. They answer different questions. The overall rate is not the average of 40% and 25%; those transitions have different denominators. In this simple sequential example, 0.40 × 0.25 = 0.10.
A larger percentage drop does not automatically identify the most valuable intervention. Check the number of affected accounts, the cost and feasibility of a change, customer suitability, and what the evidence says about the obstacle.
After clearer import guidance is introduced, compare a suitably observed cohort and note other changes. A different acquisition source could bring better-qualified accounts. A buying-season change could shift timing. A better rate is encouraging but does not isolate the cause on its own.
Also look beyond the purchase count. If unsuitable accounts buy and quickly cancel, a higher final-stage rate may not improve the business or the customer experience. Keep refunds, retention, and support consequences visible.
When sharing the funnel, state what is missing. Unknown acquisition events, untracked paths, or incomplete observation do not make the whole tool useless. They define how far the current conclusion can safely reach and which measurement improvement would be useful next.
Investigate the obstacle before buying more arrivals
The team suspects that import problems are making evaluation difficult. It can observe an import attempt, examine relevant support and usage evidence, and test a focused change. If the suspected obstacle is absent, the hypothesis changes.
For a later comparison, keep account definitions and observation windows consistent and account for other changes. Review completed evaluations and durable purchases rather than celebrating a busier trial page. The funnel has done its job when it leads to a defensible next investigation.
How to apply it
- Select one offer, audience, and unit of analysis. Write down how a new prospect enters the measurement.
- Define stage entry events. Record the event dates and the evidence needed to count them.
- Check a few real journeys manually. Find duplicate records, missing events, and stages that exist only in the team’s assumptions.
- Follow a cohort through a suitable observation window. Calculate each transition and the overall purchase rate.
- Investigate one important obstacle using conversations, support requests, or observed behavior. A drop-off locates a question; it does not explain the answer.
- Test one change and compare a later, similarly observed cohort. Keep the audience and acquisition source in view when interpreting the difference.
Common mistakes and limitations
A seller’s pipeline and a buyer’s funnel are related views. The pipeline helps manage active selling work; the funnel aggregates progression. Neither should hide missing evidence behind optimistic stage labels.
Do not maximize every conversion rate independently. Rejecting unsuitable prospects can lower a stage rate while improving customer fit. Likewise, a larger top stage can look healthy while producing fewer durable customers.
Attribution gaps, small samples, seasonality, and long purchase cycles can distort comparisons. Track revenue quality, refunds, and retention alongside acquisition. A funnel does not reveal motivation or establish that a campaign caused a purchase.
Alternatives and related frameworks
AIDA helps write and review a message. Although its language resembles funnel stages, attention and desire are not automatically trackable customer events. Use a funnel to measure behavior and AIDA to inspect communication.
Marketing Mix (4 Ps) checks the offer, price, access, and promotion. Use it when a stage problem may arise from the offer itself.
Jobs to Be Done investigates the progress people seek. Use it when a drop-off tells you where people leave but not why.
Sources and further reading
- Salesforce, What Is a Sales Funnel? Complete Guide and Examples, accessed October 21, 2026. Practitioner explanation of the buying journey and context-dependent stages. The cohort method, arithmetic, and fictional example above are FrameworkWorld’s application.